

Good Evening
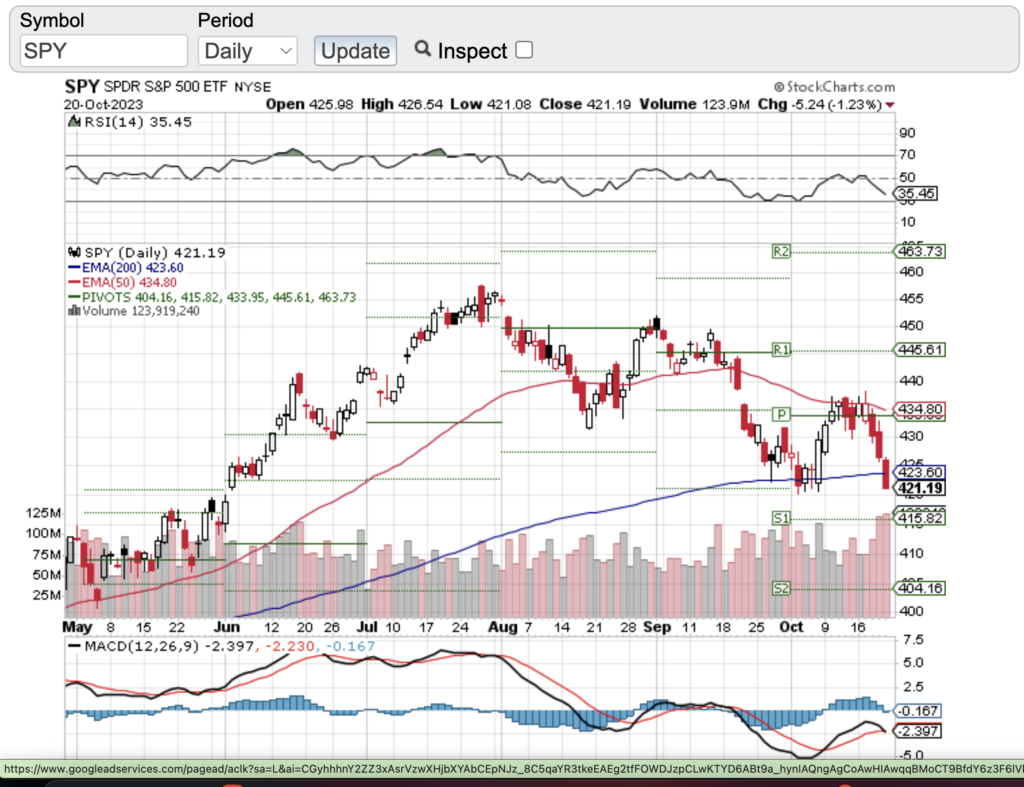
I’m going to do something a little different tonight. I’m going to go through the bull thesis, and the Bear thesis. The Bull thesis is that we are just going to go straight up from here. The last 12 Mondays have been green. If this time is going to be the same, we should be starting that on Monday, so tomorrow should be straight up . What would this do? I want to point out that we have stopped going higher on our absolute uptrend which means if you connect our bear market low back in October of last year to our bounce in March, we’re currently below that level of 422.50. So, this is either a massive bear trap or this time we’re going to be going lower. As I mentioned we’ve stopped going up and now we’re below the 50 Day moving average we got a rejection and now we are below the long-term price which is the 200 EMA or 423.60. If this is going to work out for the bulls, we would need to see daily candle closes back above the 200 DMA right at 423.60 . But then we really must form a weekly higher high. The first thing to look for is going to be two consecutive daily candle closes over roughly 422.3 and this number is going to be important, so please pay attention here. 422.3 is going to be our 200-day moving average or the long-term price and if we’re going to go non-stop up from here it should be no problem to reclaim that area because we’re supposed to go straight up, straight up, not looking back. So, 422.30…. is our weekly low going back to September 25th, and this should be our low here for the month, 422.29 is exactly the September low, so 422.3- 422.90. This either means that we’re going to get a failed breakdown if we’re above it or we got a breakdown because we’re below it. A failed breakdown is bullish. A breakdown is bearish. So, there is no bull story If we’re below 422.3. That means that we could be back above our current uptrend, which is roughly at 423. And then we have to move even higher to reclaim our uptrend we gotta make it to 430 so it’s nice that we get back above our 200 day moving average but for us to actually complete the pattern we need to form a higher high from here meaning we’ve got to form a higher high. So, the bulls must make it go up, up, up. We would have to make it all the way back to 438 because 438 would be a weekly higher high. Our high so far is 438.14, Also if we look at the monthly chart that would also mean above our August low at 433. And then finally, we’ve got our July low at 438. I hope you’re understanding how important these numbers are. The bulls net about a 4%. That’s a pretty big move. The Bulls better make sure they’re going to be pushing higher, this is a bounce or die situation, if we keep going straight higher from here, evidence is going to be that we’re closing above the 200 day moving average for two days, then we have to close above the 50 day moving average for two more days and then we have to close the month out higher. Why? Look, we’re supposed to be closing at the high of the month. If we’re currently delayed, that might not happen
Here’s the bear scenario. First off the risk reward isn’t as good for the bears just because for the Bears to know that they’re wrong, they’re going to have to wait until SPY goes to 438 or print that monthly higher high. Which means they’re gonna have to suffer through a 4% rally and then they’re gonna know they’re wrong. That’s the same thing that bulls had to go through. I mentioned in the recent past over and over that if we print a monthly lower low, that’s a long way from where we are currently. SPY Started getting bearish in July, and I mentioned that we’re going to have to suffer a decline of 5 to 6% before we get. Evidence, not feelings, not how we feel, but evidence we’re wrong by printing a monthly lower low, which would lead to lower highs and lower lows. So bulls had to suffer through a 5% decline. The bears are now going to have to suffer through that exact same thing. However, there’s a cheat code for the for the bears, so the bear thesis can get more momentum The thing I’d be looking for would be that first of all, we get a weekly candle close below 422.29. SPY has that Bearish Engulfing Weekly Candle. So if we print a new low, by getting below 420 we are going to go lower. So if the bears are able to make a new low on the month, that would be bearish. If they close the the week out right again below this month I would assume we’re op is 392. That’s getting awfully close here to 386. So if the bears were able to close the month out and let me just do a quick check here because I want to see when the last calendar date of the year is. If we go here, October 31st is going to be on a Tuesday, which means that we’re going to get a weekly candle closed this Friday and then we get the monthly candle close next, next Tuesday. So if we close the month below 422. We’re not going higher and we’re probably going into some kind of big crash, right? Some kind of 1987 crash, I think. So if we don’t go up, clearly that’s bearish and the bears would gather more momentum because the the monthly chart, there’s clearly a lot of damage here. So a bearish engulfing, closing at the low of the week likely going to get continuation. And then we look at the daily chart and the daily chart. We’re below the 200 Day Moving Average. This is where forced selling happens. It happens below the 200 day moving average or the long term price because the long term price is supposed to be strong support. So now that i’ve laid out both the bear and the bull thesis watch the chart and pay attention to price action.
We are in cash at the moment and I’ll keep you updated as always.
Cheers,
G. Allan Collins