

Hey Everybody,
I hope everyone had a great weekend,
The good news is that Congress passed a bill that will fund the government through November 17th the bad news is that we will end up going through this whole drama again in about 6 1/2 weeks .The S&P futures are up 19 points, and the Nasdaq 100 Futures are up 104 points as I write this and the bulls need a real bounce that will stick and not fade away by the close at 4pm tomorrow. I mentioned last week that we were oversold and due for a bounce and we did get a pretty big Pre-market bounce on Friday, which I was very confident would fade, sure as you’re born the S&P 500 turned a 38+ Gain into a loss of 0.27% or 11.65 to close at 4,288. We went from oversold to short term to overbought fast.
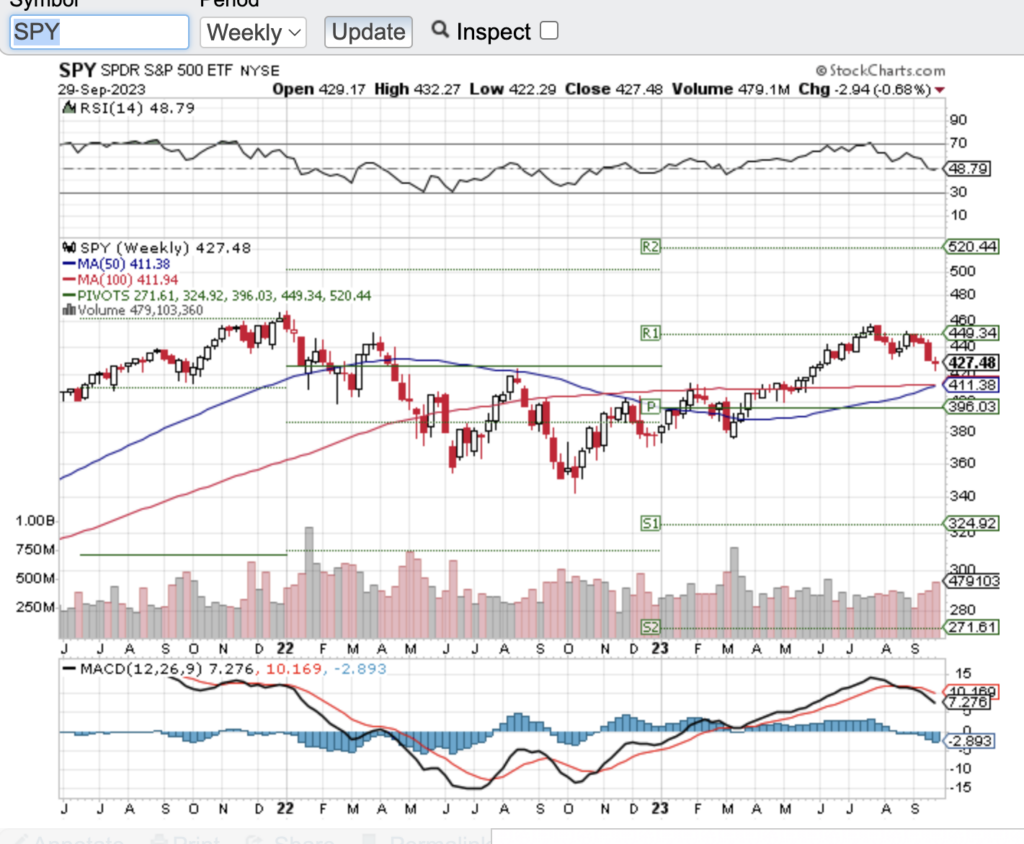
Tonight, I’m going to go over a few very important weekly charts starting with SPY. Last week I mentioned that we would likely come down towards 430 and if the bulls could not hold 430, I expected a quick trip down to 420, they sold it off all the way down to 422 which happened to be the support trendline for SPY last week. This week it moves up to 424 We didn’t close below the trendline, but we are on shaky ground. On Friday we printed a lower low after that previous lower high print which means there is a short-term downtrend developing.
Now this is usually when you are going to get the most polarized view of the market because you can make a very valid case that this is now starting to be a downtrend, but the bulls still have the advantage of this being a weekly uptrend until we lose the support trend line Which means you are going to need to break SPY 424 and start to see price action making higher highs and higher lows So in my opinion, the support trend line is the most important level to pay attention to. And if we break below that, there is going to be a very good chance that we could go all the way back down towards 400 and that would obviously be a much more bearish scenario because that would be a very powerful downtrend So this support zone between the support trend line and this level at 430 on SPY is very critical. The bulls really need to get price action back above 430 fast and then continue to push higher and break out of this downtrend. To confirm that we’re going higher. If we bounce to a lower high and then slice right through this support trendline, that is where we are likely going to get very high-volume panic selling. And that’s why I’m telling you, if we break down below this support, there’s a good chance we’re going down towards 400. So the bearish scenario is very clear and it requires a break of the trend line at 424 and the bullish scenario is technically still valid while SPY is above 420, if you’re a bull, be very careful if we bounce towards resistance, which is going to be that zone between 436 and about 444 is Critical resistance. The bulls need to break that level if we start to bounce from support, and the bears simply need to maintain this newfound downtrend of the weekly lower high and lower low to continue to push down through support. And then the bears should have an easy path lower towards 400. So that’s my opinion on where the market is going, you really need to let the price action do all the talking so that you don’t miss the next leg in this market. Because whether it’s down or up, as traders we couldn’t care less. We simply want to be on the right side of the trade. So know those very critical levels, draw them on your chart, put them in your trade plan and know exactly what you’re going to do.
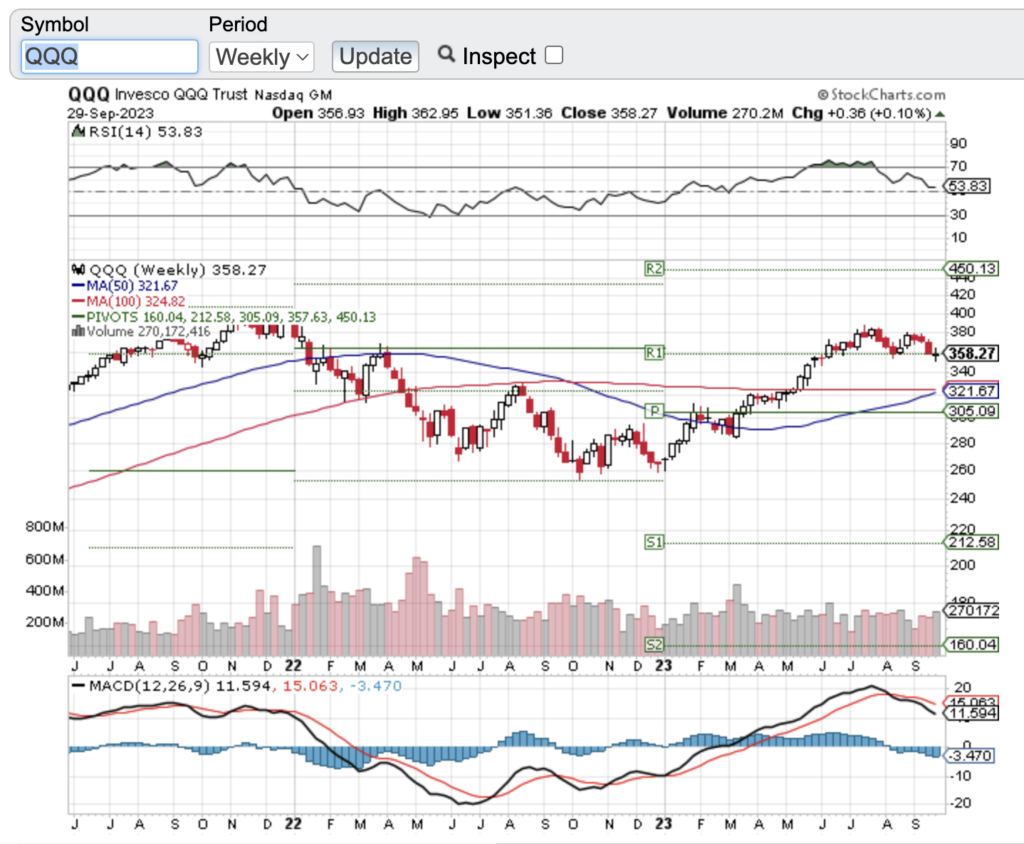
he Triple Q’s, weekly chart above is up next. The QQQ is pretty much the same exact story. We’re sitting on the trend line on the weekly chart. We bounced off of it intra week and we still have the lower high, lower low rejection. Which could be warning us that if we break down, we’re going to much lower prices. So in the triple Q’s, I think that critical level is right around 350. And if we break down below 350, it looks like a straight line flush to 330, which is the only place we are going to find support below 350. The triple Q’s went up parabolically and they sliced right through 330 and never looked back. Which means there is no support below 350. If we break 350, it is going to be a very powerful flush to 330. That’s what the weekly chart is telling us. So don’t ignore price action if we break through that critical support now.
At the same time, do not assume support is going to break. Wait until it breaks and get confirmation. So if we break 350 it is a risk off market. Which means you can short below 350 all the way down to 330. But as long as we are above 350, the bulls are optimistic that this could still be a strong bull trend trying to push to the previous all-time highs.
Open Positions: Currently We Have Short Positions On The Following:
AMZN
AVGO
NVDA
TSLA
Have A Great Night
Cheers,
G. Allan Collins